|
|
 |
Study this lesson and Chapter 3 in your text. Also read Appendix B at the end of Chapter 3. Complete hw3. Data Transmission Fundamentals In this lesson we will study the difference between analog signals and digital signals. We will study the fundamental building blocks of these signals, and methods of representing these graphically. Also, in this lesson, we will investigate detrimental influences on signals, like background noise and attenuation. We will then define the signal to noise ratio and take a look at how to represent this in decibels. This will include some practice working with decibel mathematics. Finally, we will study Shannon's Capacity Theorem. Using this theorem, we can calculate the maximum theoretical data transmission rate for a given channel. Let's get started! Analog and digital Signals At a basic level, analog an digital mean continuous and discrete. This is well explained with an example: Digital Analog
Digitization Example: Step on the bathroom scale in the morning. Measure your weight (rounded off, of course). Step on the scale later on in the day. Has your weight changed? Yes, because you eat, drink and sweat. Your weight varies on a continuous scale between an upper and a lower boundary. Summary: Analog signals are those that vary on a continuous scale, taking any value between some upper and some lower boundary. Digital signals take on only discrete values between an upper and lower boundary. Fundamentals of Signals Try out this test tone which sweeps from 300 Hz to 3000 Hz in 10 seconds. You'll need something that can play a .wav file (QuickTime for example). Check out these abbreviations: f Example: Human voice ranges from about 300 Hz to about 3300 Hz, according to the phone company. Some people can produce higher frequencies, perhaps up to 5000 Hz. Humans can hear frequencies from about 50 Hz up to about 15,000 Hz. A
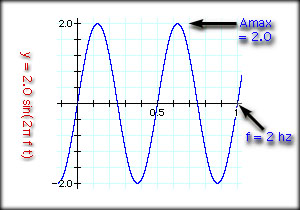
Take a look at the following graph of a sine wave. The graph shows the amplitude (A, on the Y axis) and time on the X axis. This sine wave is graphed in the "time domain." That means the X axis represents time. The wave repeats twice in one second. One cycle takes a half second, two cycles take one second. The maximum amplitude is 2 and the frequency is 2 Hz.
f = 2 Hz or 2 cycles/sec If this were alternating electrical current, AC: f = 2 Hz As time passes, the value at any instant in time is calculated with the following sine wave equation: y = Amax sin(2Pi f t) So, our example graph would be based on: y = 2.0 sin(2Pi 2 t) You can try calculating values at different times using your calculator. y = 2 sin(2 Pi 2 t)
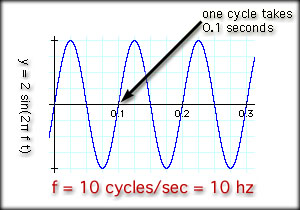
The values in this table will produce the sine wave shown a little earlier in this lesson. HOWEVER, you need to change your calculator from degree mode to radian mode. Check your manual. Most $12 dollar scientific calculators can do this. You set the mode to radians, plug in the value and hit the sine button. If your calculator won't do this, then note the following conversion. There are 2 Pi radians per 360 degrees. Pi is approximately 3.14 = 45 degrees x 2 Pi radians / 360 degrees Another Example: Change 4.0 radians into degrees. = 4.0 radians x 360 degrees / 2 Pi radians If we increase the frequency, what happens? y = 2 sin(2Pi 10 t)
Here is what the graph will look like. Note that the cycles per second have increased. There is one cycle in 0.10 seconds. Therefore, in one second there are 10 cycles. That may be obvious, because the frequency is ten hertz.
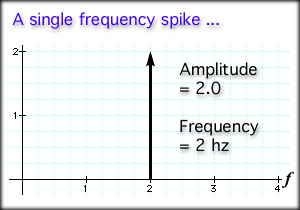
Another name for cycles per second is hertz, or Hz, as mentioned earlier. The signal above has a frequency of 10 Hz and a maximum amplitude of 2.0. Note that in the two examples above, the frequency remain and maximum amplitude remain constant. We may also graph these examples in the "frequency domain". That means we make a graph comparing amplitude on the Y axis and frequency on the X axis. Our first example above had a frequency of 2.0 Hz and an amplitude of 2.0.
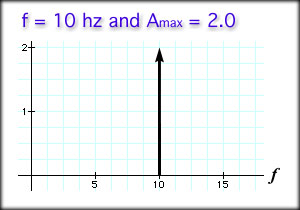
As you can see, an arrow at 2.0 Hz with a height (amplitude) of 2.0 is drawn on the graph. The arrow is called a frequency spike because it represents a single frequency. The height of the spike represents the maximum amplitude of the signal. For our second example the frequency domain would look like this:
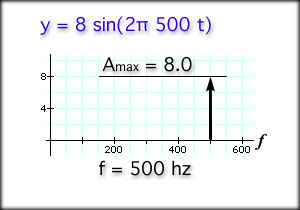
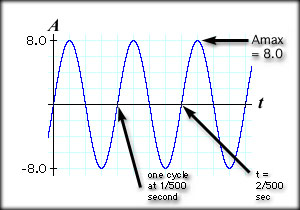
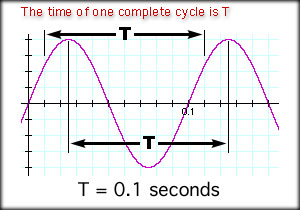
The spike occurs at f = 10 Hz and the amplitude is 2.0. Example: Sketch the graph in both the time domain and the frequency domain of the following: y = 8 sin(2Pi 500 t) Look at the equation and determine by inspection that the frequency is 500 Hz and the maximum amplitude is 8.0. Now, sketch out your graphs. They should look like the following two graphs. Time Domain The hard way to complete this task is to try it on a calculator. It is better to note that the frequency is 500 Hz, so there are 500 cycles in one second. That also means that one cycle takes one five-hundredth of a second (labeled). From the preceding example, we learned that knowing the time for one cycle is convenient when trying to graph a wave in the time domain. The time for one cycle is called the period, abbreviated as T. T = 1 / f and, f = 1 / T Example: If the frequency of a signal is 10 Hz, what is the period? T = 1 / f = 1 / 10 Hz = 1 / 10 cycles per second When frequency is constant, like in the following graph, the period can be measured from any two identical points. The two points define a single cycle.
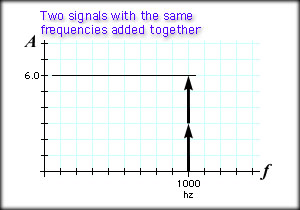
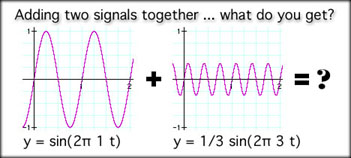
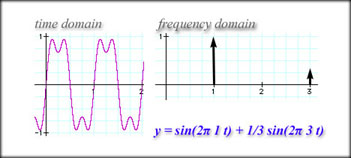
Building a Square Wave If you turn on two test tones at the same time and they both have identical pitch and loudness, they will add together. They have identical pitch (frequency) so their amplitudes add together. Example tone 1: f = 1000 Hz, A = 3.0 You would hear the following: tone: f = 1000 Hz, A = 6.0 Here is a representation in the time and frequency domains. Time Domain Frequency Domain The mathematical version of this follows. Note that the amplitudes end up adding together and you have a single tone at the same frequency. tone 1: y = 3 sin(2Pi 1000 t) Y = tone 1 + tone 2 What happens when you add two signals together and the frequencies are not the same? At some locations the amplitudes of the signals add together in the time domain. At other times they will have different polarity and subtraction will occur. In the frequency domain, the spikes occur at totally different locations. Example y1 = sin(2Pi t) These are graphed separately below: The time domain will represent the sum of the two equations: y at time t = y1 + y1 = sin(2Pi t) + 1/3 sin(2Pi 3 t) The frequency domain will show the two distinct frequency spikes, one at 3 Hz with an amplitude of 1/3 and one at 1 Hz with an amplitude of 1.0. here they are:
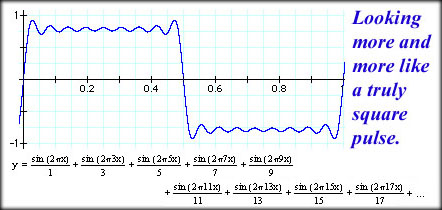
Take a look at page 39 in Data and Computer Communications for similar discussion of adding waves together. By adding just the right waves together, we can build a square pulse. It turns out that we need to add successive waves where the amplitude is smaller each time and the frequency is higher each time. Take a look at the following equation: y = sin(2Pi f t) + 1/3 sin(2Pi 3f t) + 1/5 sin(2Pi 5f t) + 1/7 sin(2Pi 7f t) + 1/9 sin(2Pi 9f t) + 1/11 sin(2Pi 11f t) + ... The farther we go with this the more square our wave will be. Take a look at the following.
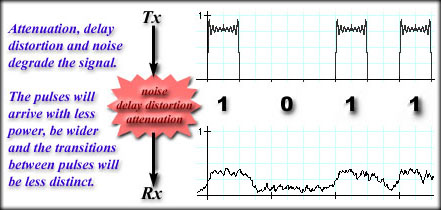
This leads to some important issues: * To create a perfectly square pulse you have to have an infinite number of waves added together. * Each term adds a new and higher frequency to the collection. A perfectly square pulse needs infinite bandwidth. * Because wires, fiber and air tend to have restricted bandwidth we have less than perfect signals. Of course we would need to build equipment that could add up an infinite number of signals. * Less than perfectly square pulses mean that we have to wait for the pulse to ramp up to its full value, which wastes a small amount of time. When you waste that tiny amount of time billions of times a second it adds up. We eventually end up having to slow our data transmission rate down. * By choosing a wide enough bandwidth we can create a pulse that is just square enough to support our purposes in transmissions. Our data rate may be limited, but we'll be able to operate within a small range of frequencies. Page 44 in Stallings' gives an example of trying to build pulses within a limited bandwidth. We can conclude that a fixed bandwidth puts a limit on our maximum data rate. Transmission Impairments Attenuation: Signals lose power as they travel over distance. Radio waves, electrical signals and optical signals all attenuate over distance. The signal may become so weak that we cannot determine the message being sent or worse, we might not even know a signal was sent. Delay Distortion: In most media, such as fiber or copper, different frequencies travel at different speeds. At great distance, two simultaneously transmitted signals will arrive at different times. Our square pulse is built up with different frequencies and that means our pulse may spread out and round off. The farther it travels, the more this occurs. Noise: Noise changes the amplitude and to a lesser degree the frequency of a signal. There are four kinds of noise. Thermal Noise is due to the vibration of electrons in conductors. The vibration of these electrons creates a small amount of current that varies in a random pattern. The higher the temperature of the conductor, the higher the thermal noise is. Stallings gives a short equation you can use to determine the amount of noise in a certain frequency range. Intermodulation Noise is interference with the intended signal that comes from the by products of intended signal combinations. All right, I know you are saying, "huh?". When two different frequencies are transmitted simultaneously they produce signals that are called harmonics. These harmonic signals are sums or differences of the two intended signals. harmonics occur at: f1 + f2 and f1 - f2 Harmonic signals are lower in power, but they might interfere with other intended signals at the new frequency. Crosstalk is the mixing of intended messages and other intended messages. You might have notices this on rare occasion in the Public Switched Telephone Network (PSTN). You can hear, faintly, some other conversation on the line. Impulse Noise is, for example, electrical sparks or lightning. Electrical discharge releases a wide spectrum of electromagnetic energy. These electromagnetic waves interfere with an intended signal. You've heard your radio crackle as lighting strikes in the background. That's a prime example of impulse noise. All of these impairments cause our nice reasonbly-square pulse to degrade. At the worst, we end up with an unintelligible mess that we may not know is the signal.
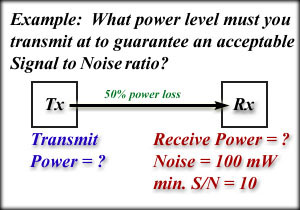
The graphic above shows the combination of noise, delay distortion, and attenuation. In Stallings, figure 3.16 shows the intrusion of noise as a summation of the noise signal and the intended signal. Take a look at that as well. While our signal loses power over distance the effects of noise are gradually taking their toll. Our concern changes from "how square is the pulse?" to "Where is the pulse?" To determine what was transmitted our signal must be stronger than the noise. We describe this comparison in a ratio, the signal to noise ratio. S/N = Power of the Received Signal / Power of the Noise Where P_s is the received signal power and P_n is the power of the noise. We hope the ratio is greater than one. In fact the larger it is, the better. We are not so much concerned with the power level of the noise as we are concerned about its relative strength in comparison to the signal. That is why the signal to noise ratio is so important. Example: What is the signal to noise ratio, S/N, if the signal power is 100 kW and the noise power is 100 W? S/N = P_s / P_n = 100 kW / 100 W As you can see, the signal to noise ratio has no units because the units in the numerator and denominator must cancel out. In the above problem we had to change from kilowatts to watts to get the units to cancel. This is a good check on your work. Ask yourself if the units canceled out properly. Another Example: Half the power is lost due to attenuation when transmitting a signal over a 2 mile cable. If the noise power is 100 mW and the absolute minimum signal to noise ratio is 10 to 1 (or just 10), what is the minimum power level that you must transmit at? Draw a diagram to set this up ... Tx = Transmit Power First determine what the receive power must be: S/N = P_s / P_n = Rx / P_n Half the transmitted power is received ... Tx (1/2) = Rx Decibels Scientific notation might be useful in solving such problems, but there is a better way to deal with such large and small numbers. By using logarithms to reduce the magnitude of a number and convert multiplication and division operations into addition and subtraction we simplify our work a great deal. We'll perform this operation by doing our calculation in decibels. Appendix B at the end of Chapter 2 in Stallings discusses decibels. Definition of a bell: A bell is the log_10 of a number. There are 10 decibels in a bell. So, y_dB = 10 log_10( y_absolute ) The equation above reads like this: Y in dB equals 10 times log base ten of the original y. Example: If y = 345.2, what is the decibel value of y? y_dB = 10 log(345.2) Another Example: What is the value of y in dB if y = 437,476,300,000,000,000,000,000 y_dB = 10 log(437,476,300,000,000,000,000,000) Yet Another Example: What is the value of y in dB if y = 3.0 x 10^-45 y_dB = 10 log(3.0 x 10^-45) Notice in the above examples that very large and very small numbers become common everyday values. Also notice that we had not units in the examples. Units are a pesky feature of decibels. Learn the following rules by heart: 1) y_dB = 10 log( y ) 2) Keep the units. Example: Convert 15 MW to a decibel value y_dB = 10 log(15 MW) y_dB = 10log(15,000,000 W) 3) dBm is short for dB miliwatts 4) dBm + dB = dBm 5)dBm - dB = dBm 6)dBm - dBm = dB 7) dBm + dBm gives you dB miliwatts squared. We won't mess with this so don't let me catch you adding dBm to dBm. 8) dB + or - dB = dB
9) Undo your dB with y = 10^( y_dB / 10 ) Examples: a) 10 dB + 75 dBm = 85 dBm OK, so what you say. Well, let's apply some of those logarithm manipulation equations and use decibels to simplify an equation. Example: The equation below looks simple enough until you realize ... 2 2 ... the following: P = 400,000,000,000 W You can start cranking out the scientific notation, or you can do it in decibels rather quickly. y_dB = 10 log( y ) Plug in the equation for y and use the logarithm manipulation rules you reviewed earlier this semester. You'll get the following: y_dB = 10 log (P) + 20 log(h1) + 20log(h2) + 10log(L) - 40log(r) Plug in each value and continue solving ... y_dB = 116 dBW + 170 dBm2 + 115 dBm2 - 125 dB - 351 dBm4 Use the rules about adding and subtracting units of the same type. y_dB = -75 dBW You are finished, unless you want to know the number in absolute. OK, here you go ... y = 10(-75/10) Another Example: To solve this we'll follow the signal through the network. We should solve this in absolute number first, then in decibels. Tx --->1/1,000,000 attenuation ---> Rx at Satellite ---> Summary: Received at Satellite = Tx times Attenuation Boost is 4X Received at Second Earth Station = Tx times Attenuation What we actually did above is: Rx_E2 = Tx_E1 x Att. x 4 x Att. Now in decibels: Summary: Rx_dB = 10log(Tx_E1 x Att. x 4 x Att.) Rx_abs. = 10(-57/10) = 0.000002 W Another Example: Tx ---> attenuation ---> Rx; To solve this problem you have to work backwards. First figure out what the minimum received power has to be so that it meets the signal to noise ratio requirement. S/N_dB = 130 dB = 10log(Rx / N) = 10log(Rx) - 10log(N) Next work backwards to determine the transmit signal strength. You lose 60 dB on the link, so... Tx_dB - 60 dB = Rx_dB If you want to, you can convert this back to an absolute number. Try this problem on your own: On a 10 mile cable the power level falls 50% per mile. This is equivalent to -3 dB/mile, and at 10 miles that's 30 dB lost. What is the signal to noise ratio if a 100 mW signal is transmitted and the noise level at the receiver is 300 nW? Calculate your answer in dB.
Channel Capacity We've already seen that there is a relationship between bandwidth and data capacity. We also know that our signal has to be stronger than the noise for us to detect and understand it. How are these issues related? Fortunately (or unfortunately for the math-challenged) a man named Claud Shannon determined a way to calculate the maximum theoretical data rate given the bandwidth and the signal to noise ratio of the channel. Here it is. C = 2W log_2( 1 + S/N )1/2 Where: Example: Your telephone line allows signals between 300 Hz and 3300 Hz. All other frequencies are filtered out. Your modem knows this an limits itself to this range. If the signal to noise ratio on the public switched telephone network (PSTN) is 250 to 1, what is the maximum data rate you can get with your modem? W = 3300 Hz - 300 Hz = 3000 Hz C = 2Wlog_2(1+S/N)1/2 Another Example: What is the S/N ratio on your phone line if your modem tells you it's operating at 53,000 bps and the bandwidth is 3000 Hz? W = 3000 Hz (given) C = 2Wlog_2(1+S/N)1/2 Yet Another Example: How much bandwidth do you need to get 1 Mbps when the S/N ratio is 200,000 to 1? C = 1,000,000 bps (given) C = 2Wlog_2(1+S/N)1/2 How many times greater is this than what the phone company currently gives you? You currently get 3000 Hz. 56,787 Hz = y(3000 Hz) Shannon's equation determines the maximum theoretical data rate, but it doesn't tell us how to achieve that data rate. We have to choose a number of signals to send per second and the number of bits that each signal represents. Then we may attempt to transfer data. Note: We may attempt to exceed the theoretical maximum, but we will encounter an unacceptable number of errors. Comparing Attempted Data Rate with Theoretical Maximum The attempted data rate is the number of signals we send per second times the number of bits each that each signal represents. From now on, we'll refer to a single signal as a symbol. The collection of unique symbols is the symbol set. R = r n Where R is the attempted data rate in bits per second, r is the rate we send symbols (unique signals) and n is the number of bits represented by a symbol. Example: What data rate does your modem attempt when it sends 2400 symbols per second and each symbol represents 8 bits. R = r n Another Example: At what rate does your modem sends signals if the data rate is 53,000 bps and each symbol represents 9 bits. R = r n Why describe this as the "attempted" data rate? While we may design a system at a certain data rate, that doesn't mean we meet the three physical limits discussed earlier. Keeping all other things the same ... * If we try to represent too many bits with a symbol, we will encounter an unacceptable error rate. * If we try to send too many symbols per second, we will encounter an unacceptable error rate. Shannon determined two other theoretical limits. These two limits determine the maximum number of symbols per second and the maximum number of bits per symbol that we can have. r < 2W Where r is symbols per second (max) and W is the channel bandwidth in Hz. n < log_2(1 + S/N)1/2 Where n is the maximum number of bits per symbol and S/N is the signal to noise ratio. These are limits on what we attempt to accomplish. Please notice that C is the theoretical limit and R is what we attempt. Therefore, we must meet the following restriction as well. R < C Example: The signal to noise ratio is 250 to 1, the bandwidth is 3000 Hz. These are typical values for the PSTN. What are the three limits? #1 #2 #3 Another Example: Your network has a bandwidth of 10,000 Hz and the signal to noise ratio is 300 to 1. You attempt to send 26,000 symbols per second with each symbol representing 3 bits. (a) What data rate are you attempting? R = r n (b) Do you pass any of the three physical limits? #1 #2 #3 (c) Will this link function without a significant number of errors? NO. The first test failed. (d) What must be done to solve the problem? The number of symbols sent per second must be reduced to, at most, 20,000 symbols per second. Doing so will reduce your data rate to: R = 20,000 x 3 = 60,000 bits per second However, we can use up to 4 bits per symbol, so lets boost n up to 4. That will bring us up to 80,000 bps, the maximum. Summary: There are three limits that we must meet in order to avoid a significant number of errors on our channel. 1) r < 2W From these three limits we may conclude: * Bandwidth limits the symbol rate Back to the top of the page. |
| [INF 680 Syllabus] [How to Start] [Schedule] |
Used with permission of the Author; Copyright (C) Kevin A. Shaffer 1998 - 2018, all rights reserved. |